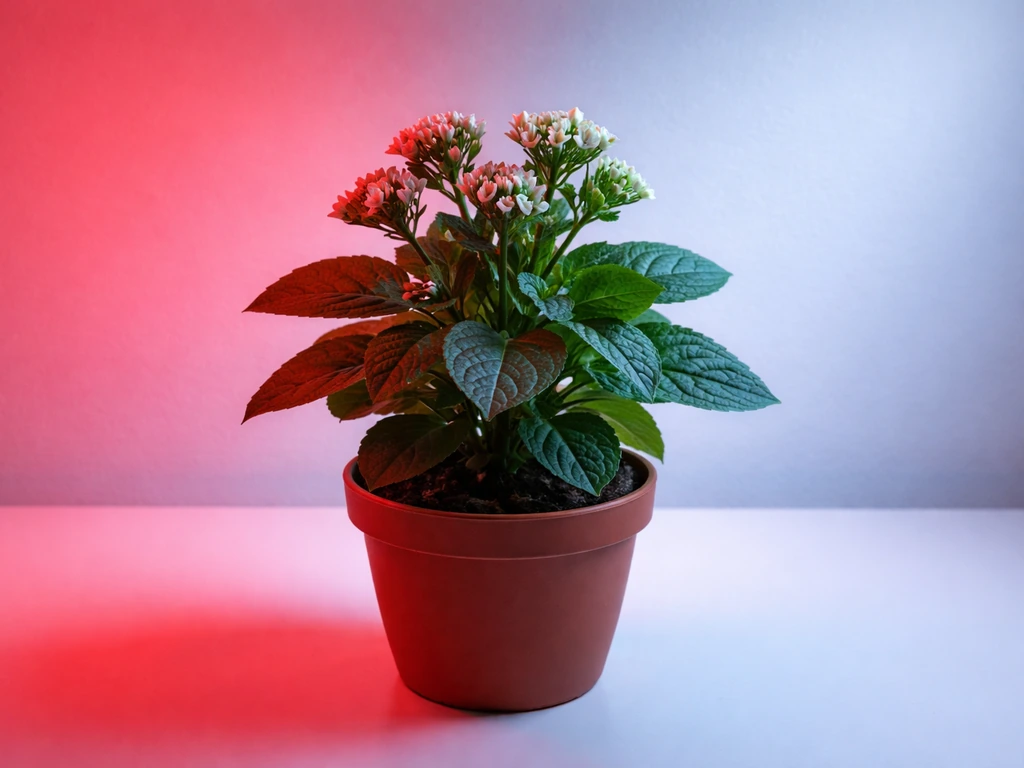
Plants grow best under red and blue light. Red light (around 650–675 nm) drives photosynthesis most efficiently, while blue light (around 450–475 nm) supports compact, healthy leaf structure. Together, they cover the two peaks that chlorophyll a and chlorophyll b absorb most strongly. If you're running a science fair experiment to test this yourself, that's the result you should expect to see, and with the right setup, you absolutely can demonstrate it clearly with fast-growing plants like lettuce or radish in two to three weeks. Scientists have long shown that plants need light to grow, which is why controlled light-color experiments reliably produce measurable differences in growth.
Under What Color Light Do Plants Grow Best for a Science Fair
Marcus Hartley
13 Jun 2026
Why light color matters to a plant in the first place
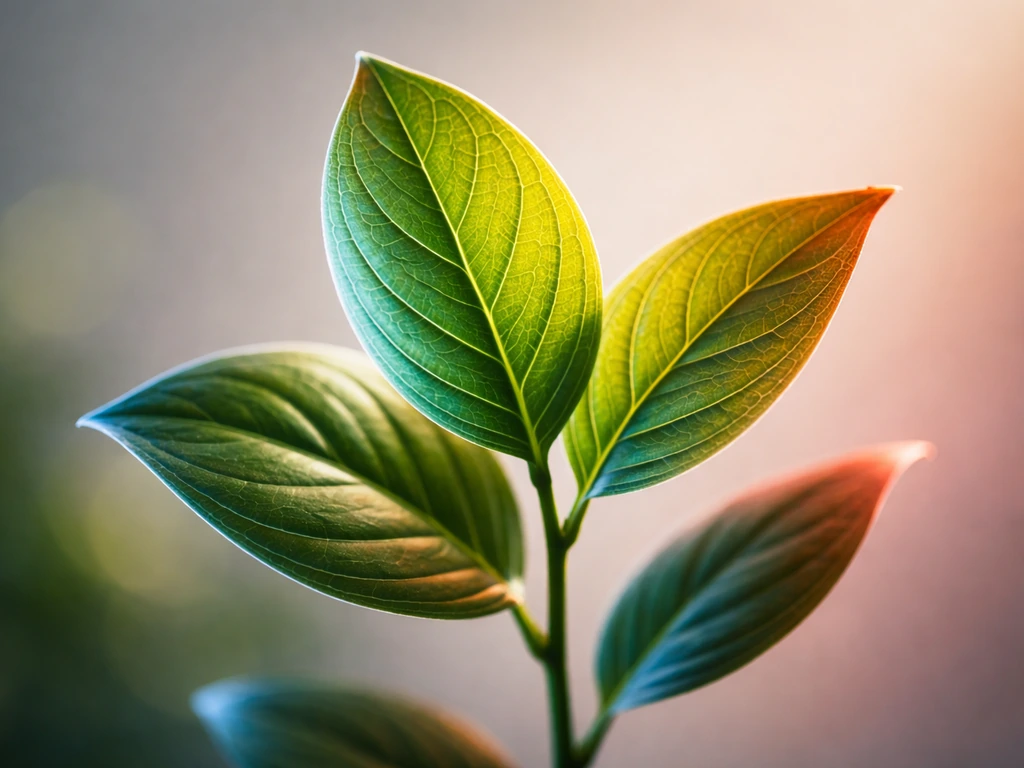
Light isn't just 'on' or 'off' to a plant. It's a mix of wavelengths, and plants have evolved pigments that absorb specific ones. Chlorophyll a and chlorophyll b are the workhorses of photosynthesis. Chlorophyll a has absorption peaks near 430 nm and 662–664 nm (that's blue and red), and chlorophyll b peaks near 453 nm and 642–647 nm. Those numbers aren't trivia, they're the reason grow lights are often purple-pink. They're hitting exactly the wavelengths where chlorophyll grabs the most photons.
Carotenoids, the secondary pigments that make carrots orange and contribute to that yellow-green in young leaves, absorb in the 400–500 nm range (blue/blue-green). They act like antenna pigments, capturing wavelengths chlorophyll misses and passing that energy along. So the plant does squeeze some value out of a wider blue range than chlorophyll alone would suggest.
Green light (roughly 500–570 nm) is largely reflected by chlorophyll, which is why plants look green to us. But here's the thing that surprises a lot of people: green light isn't useless. Because chlorophyll doesn't absorb it strongly at the leaf surface, green photons penetrate deeper into leaf tissue than red or blue ones do. Research using radioactive CO2 tracing (14CO2 fixation experiments in spinach) confirmed that blank" rel="noopener noreferrer">green light drives CO2 fixation deeper in the leaf, while red and blue are absorbed more at the surface. Thick, dense leaves especially benefit from this deeper penetration. Still, across most experiments, red and blue outperform green for overall plant biomass when intensity is held equal.
Which light color actually grows plants best
When researchers control for light intensity (more on why that's critical later), here's what consistently comes out across studies on leafy crops like lettuce, spinach, and radish:
| Light Color | Wavelength Range | Effect on Plants | Verdict |
|---|---|---|---|
| Red | ~620–680 nm | Highest photosynthesis rates, drives shoot elongation and biomass. Red alone can reduce compactness and cause leggy plants. | Great for growth, but needs blue to balance it |
| Blue | ~430–480 nm | Promotes compact, thick leaves; supports chloroplast development; higher chlorophyll content per leaf | Great for plant health and structure |
| Red + Blue combined | ~450 nm + ~660 nm | Best overall: highest fresh weight, plant height, and photosynthetic performance in multiple studies. Example: lettuce plant height peaked at 6.86 cm with red+blue vs other treatments. | Best combination for most growth goals |
| White | Broad spectrum | Includes red and blue within a full spectrum. Often performs nearly as well as targeted red+blue because it contains the key wavelengths, plus some green. | Practical and effective, especially for home growers |
| Green | ~500–570 nm | Penetrates leaf tissue deeply; contributes to photosynthesis but less efficiently at the surface. Useful as a supplement, not a primary source. | Weak on its own, useful as a small addition |
| Yellow | ~570–620 nm | Minimal absorption by chlorophyll. Produces poor results as a sole light source. | Least effective for plant growth |
One study (BMC Plant Biology, 2025) found that red+blue LED treatments produced the highest fresh weight and plant height in lettuce and baby greens compared to other spectral combinations, while red light alone actually reduced biomass. White light, because it contains the full spectrum including the blue and red wavelengths plants need, performs well in practice and is why full-spectrum LED grow lights are popular for home growing.
What 'best' looks like for different plants and goals
The right answer also depends on what you're trying to grow and what growth outcome you're measuring. 'Best' isn't one-size-fits-all.
Seedlings and microgreens
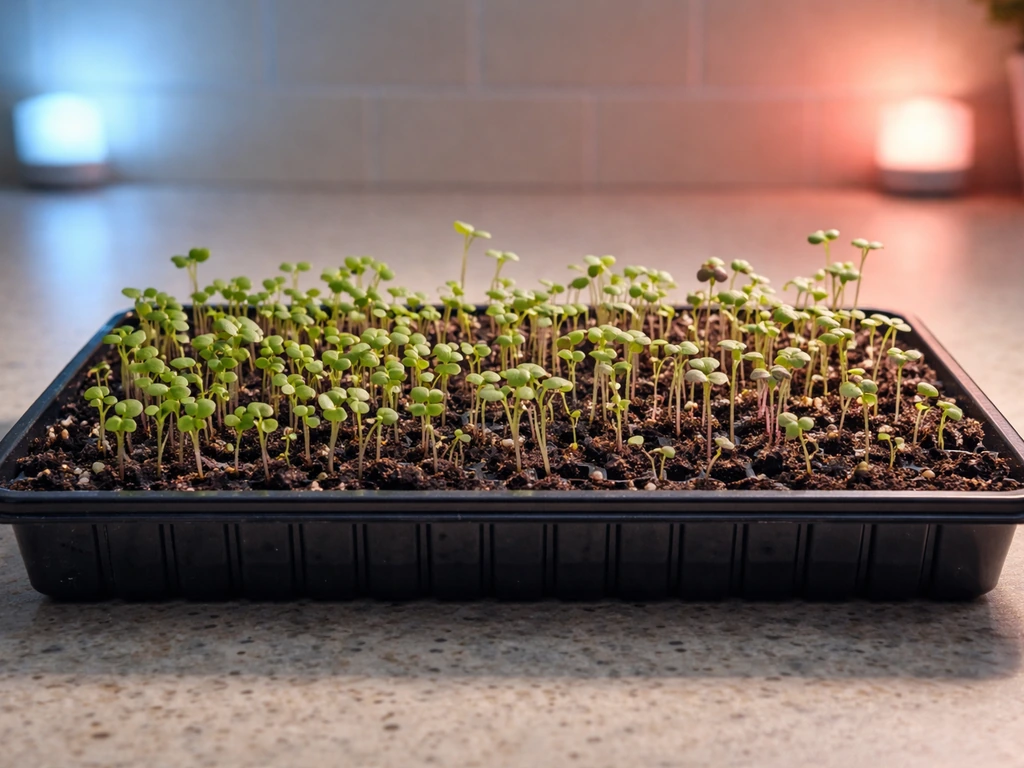
For early germination and seedling development, blue light is especially valuable because it promotes compact, sturdy growth and prevents etiolation (the leggy stretching that happens when seedlings don't get enough light). When plants get less light overall, they often stretch upward toward the nearest light source in a process called etiolation less light stretching (etiolation). Microgreens experiments using defined 16-hour photoperiods and harvesting around 12 days after sowing show that spectral quality affects hypocotyl length and fresh and dry weight from very early on. For a science fair experiment, microgreens are a fantastic test plant because you can get measurable results in under two weeks.
Leafy plants (lettuce, spinach, herbs)
Red+blue combinations consistently win for leaf area, biomass, and overall yield. NASA Technical Reports Server (NTRS) documents LED experiments on spinach, radish, and lettuce showing growth results under red lighting with blue supplementation as a reference point for these combined-wavelength effects Red+blue combinations consistently win for leaf area, biomass, and overall yield.. Studies on lettuce under various LED spectra show that both leaf area and shoot biomass peak under red+blue. Monochromatic blue alone increases individual leaf physiology (more chloroplasts, thicker leaves), but shoot biomass tends to be lower than under combined light. For a home indoor garden or science fair experiment measuring fresh weight and leaf count, red+blue or full-spectrum white is your target.
Flowering plants
Flowering is more complex because it also involves photoperiodism (how plants respond to day length, not just light color). That said, red light plays a role in triggering flowering in many species through phytochrome signaling. If your science fair project involves flowering plants, stick to measuring vegetative growth metrics, leaf count, height, biomass, rather than flower timing, since flowering adds too many variables for a short experiment.
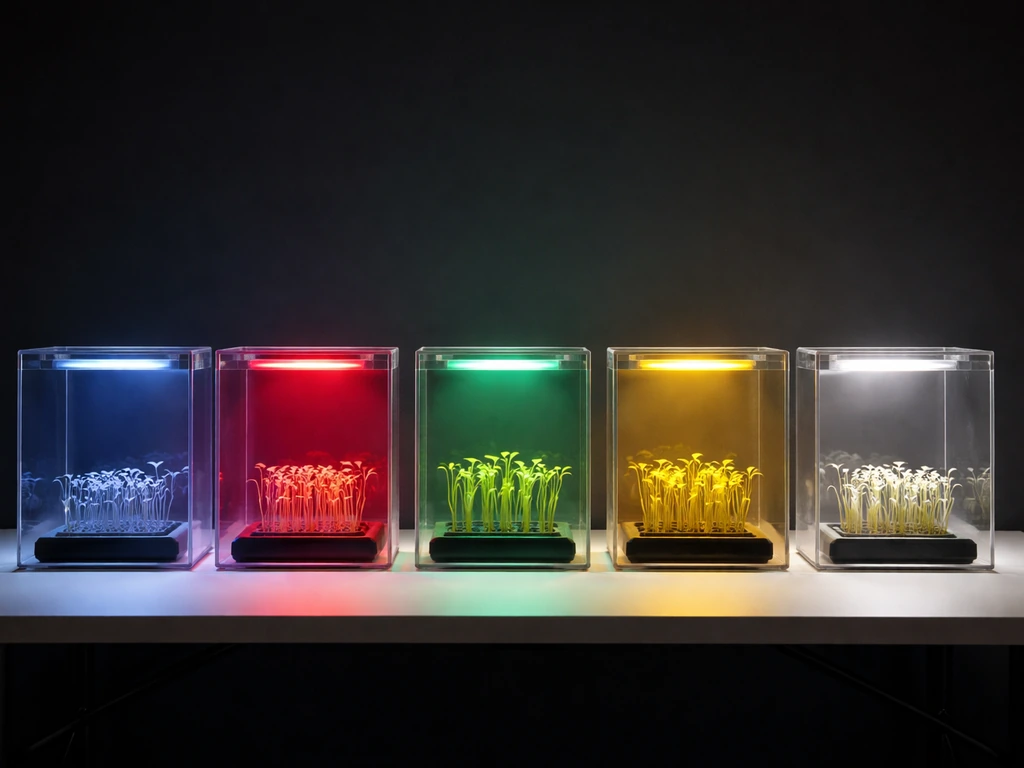
How to design your science fair experiment properly
The single biggest mistake in light-color experiments is failing to control for light intensity. If your red bulb is twice as bright as your blue bulb, you're not testing color, you're testing brightness. This is the most common reason these experiments produce confusing or wrong results. Here's how to set it up right.
Variables to control across every treatment group
- Light intensity: all color treatments should deliver as close to the same amount of usable light as possible. More on how to measure this below.
- Distance from light to plant: keep it identical across all groups, and don't change it as plants grow (or adjust all groups equally at the same time).
- Photoperiod: run all lights for the same number of hours per day. A 16-hour light / 8-hour dark cycle is a common and effective choice for leafy plants like lettuce.
- Plant species and age: use the same plant type and start all groups from seeds at the same time, or use plants of equal age and size.
- Pot size and growing medium: same size containers, same potting mix or hydroponic solution for every group.
- Watering and nutrients: water every group with the same amount at the same schedule. If using fertilizer, use the same concentration for all.
- Temperature: keep all groups in the same room, or at minimum the same temperature range. Don't put one group near a heat vent.
- Number of plants per group: use at least 3 to 5 plants per light color treatment so you can average your results and account for natural variation.
Suggested plant choices
Radish, lettuce, and arugula are ideal for science fair experiments. They germinate in 3 to 5 days and show measurable growth differences within 2 to 3 weeks. Radishes are especially good because you can measure both shoot (leafy) and root growth. Avoid slow-growing plants like tomatoes or peppers, you won't see enough difference in a typical science fair timeline.
How to produce and measure colored light at home
You have a few practical options for generating specific colors of light, each with tradeoffs.
Option 1: Monochromatic LEDs (best for science fair accuracy)
Buy individual colored LED bulbs or LED strips in specific colors: blue (~450 nm), red (~660 nm), green (~520 nm), and yellow (~590 nm). LED grow lights sold for horticulture often specify their exact peak wavelength, which is ideal. Avoid regular colored decorative LEDs, which can have broad, imprecise spectra. Look for LEDs marketed for plant growing or for photography, which tend to have more precisely specified wavelengths.
Option 2: White bulb with colored cellophane or theatrical gel filters
This is a classic science fair approach: use a single white bulb and wrap or place colored filters in front of it for each treatment group. Theatrical lighting gels (available from theater supply stores or online) come in calibrated colors. The downside is that filters absorb some light, which reduces intensity further. If you use this method, you really need to measure intensity after the filter, not before it.
Option 3: RGB LED grow lights (practical but harder to isolate)
Some LED grow lights let you control red, blue, and white channels separately. These can work if you can fully turn off unused channels, but many consumer grow lights don't let you isolate a single color cleanly. If the fixture bleeds multiple colors even on the lowest setting, your experiment won't be clean.
How to measure and match light intensity
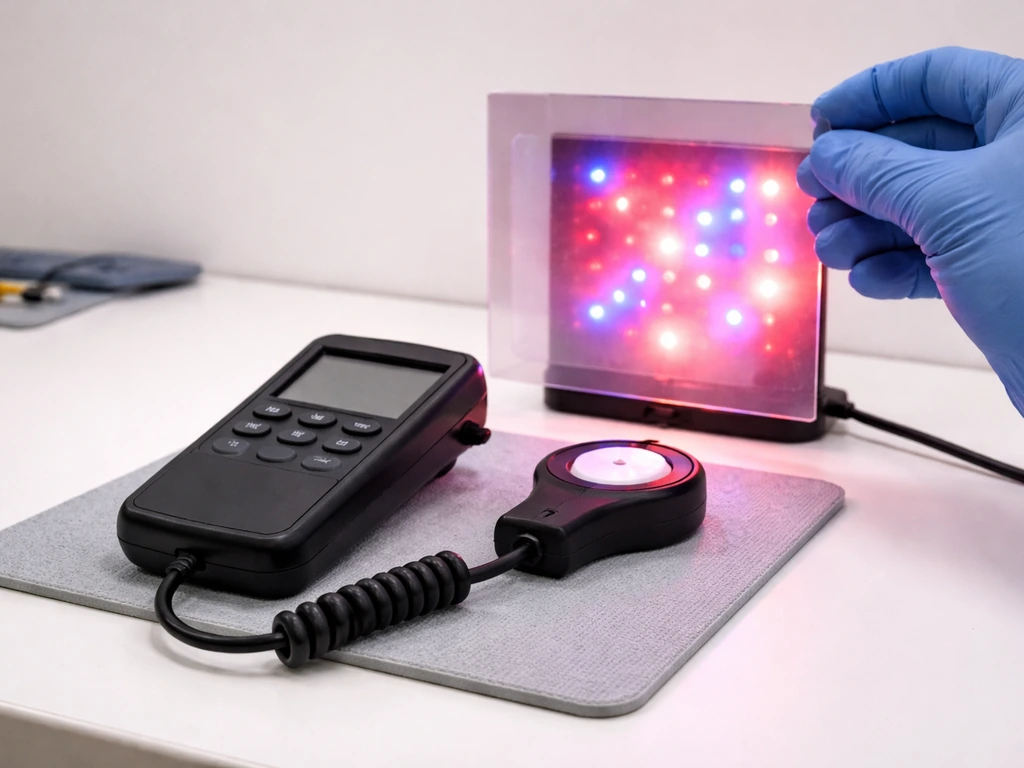
Plant scientists measure light intensity in PPFD (photosynthetic photon flux density), expressed in micromoles of photons per square meter per second (µmol m-2 s-1). This covers the 400–700 nm range that plants actually use, called PAR (photosynthetically active radiation). Lux and lumens are human brightness measurements and are not accurate for comparing plant-usable light across different colors, because a lux meter is calibrated to how sensitive human eyes are, not plant pigments. A yellow-green light looks very bright to us but doesn't mean much to a plant.
For a science fair budget, a simple quantum PAR meter or a smartphone-based PAR meter app (with a calibrated sensor attachment) is your best option. They're available in the $30–$100 range. If you can't access a PAR meter, use a lux meter and keep the lux reading identical across all treatments as a rough proxy, but note in your project that lux is an imperfect measure for plant light because it's spectrum-weighted for human vision. Adjust light distance from the plant until your readings match across color groups.
A quick note on safety
Bright blue LEDs in the 400–550 nm range carry a retinal hazard if you stare directly into them. Always look away from direct LED sources, and avoid staring at bright grow lights without protection. This applies to any high-brightness LED setup, not just blue ones.
What to measure and how long to run the experiment
Plan to run the experiment for at least 14 to 21 days after germination. That's long enough to see real differences in growth between light colors, but short enough to complete a science fair project without plants outgrowing your setup. Here's what to measure:
- Plant height: measure from the soil surface to the tallest point of the plant using a ruler. Record every 3 to 4 days for each plant in each group.
- Leaf count: count all fully opened leaves per plant at the end of the experiment.
- Fresh weight (biomass): at the end of the experiment, gently remove plants from their containers, shake off loose soil or rinse roots if hydroponic, and weigh immediately on a kitchen scale. Fresh weight is a good proxy for overall growth and water content. Do this as a final, one-time measurement since harvesting destroys the plant.
- Leaf color (greenness): take photos of leaves from each group under identical lighting (natural daylight, not your experiment lights) and compare visually. Darker green generally indicates more chlorophyll. If you have access to a SPAD chlorophyll meter (some schools have them), use it — take readings from the same position on the same leaf, at the same time of day, across all groups.
- Stem thickness (optional): measure the diameter of the main stem at the base with a caliper if you want an extra structural metric.
Record every measurement in a data table for each individual plant, then calculate averages and ranges per treatment group. Showing variability (not just averages) is what separates a good science fair project from a great one.
How to explain your results (and what they mean for real indoor growing)
When you write up your results, here's how to explain what you found in a way that sounds scientifically solid and actually makes sense:
If red+blue produced the most growth (the most likely result)
Explain that chlorophyll a and b absorb most strongly in the red (~650–675 nm) and blue (~450–475 nm) ranges, so plants can convert more of that light into photosynthetic energy. Red light drives the biochemical reactions of photosynthesis (the Calvin cycle), while blue light regulates stomata opening and chloroplast development. Together they provide both the fuel and the structural support for plant growth.
If green or white performed better than you expected
White light contains red and blue wavelengths within its broad spectrum, so plants growing under white light are still receiving their key wavelengths. If white outperformed your isolated red or blue treatments, that likely reflects the fact that plants benefit from a combination of wavelengths. For green light specifically: green photons penetrate deeper into leaf tissue than red or blue because chlorophyll doesn't absorb them as strongly at the surface. This means green light can drive photosynthesis in lower cell layers that red and blue can't reach as effectively. It's less efficient at the surface, but it reaches further in.
If yellow light produced almost no growth
Yellow falls in the gap between chlorophyll's absorption peaks. Neither chlorophyll a nor chlorophyll b absorbs strongly in the 570–620 nm range, so most of that light is reflected or transmitted without being used for photosynthesis. This is why you often see the best growth with red and blue treatments rather than pure yellow light 570–620 nm range. Poor growth under yellow light is exactly what the physiology predicts.
Translating experiment results into real indoor grow-light choices
The science fair findings map directly onto real indoor growing decisions. Here's how to apply them:
- For seedlings and young plants: prioritize blue light (or a full-spectrum light with strong blue content). It promotes compact, sturdy growth and prevents the leggy stretching that happens under warm-dominant or low-quality light.
- For leafy plants at full growth (lettuce, herbs, spinach): a red+blue LED grow light, or a full-spectrum white LED, is your best bet. Aim for a photoperiod of 14–16 hours per day and position the light close enough to deliver adequate intensity without burning leaves (typically 6–18 inches depending on the fixture).
- For flowering plants: red light becomes more important, and many growers shift their spectrum toward red as plants mature. Some grow lights have a 'veg' (blue-dominant) and 'bloom' (red-dominant) switch for this reason.
- Avoid single-color yellow or orange lights as primary grow lights — they don't deliver the wavelengths plants need most.
- Green light can be a useful supplement (some studies show small benefits from adding ~5% green to a red+blue spectrum), but it's not a replacement for red or blue as a primary source.
- White LED shop lights and full-spectrum bulbs work well for home growing because they already include the red and blue wavelengths within their spectrum, even if they're not optimized the same way a dedicated grow light is.
Whether you're running a science fair project or setting up a grow shelf in your apartment, the core answer stays the same: plants need red and blue light most, a combination of both outperforms either one alone, and keeping your light intensity consistent is just as important as the color you choose. Get those basics right, and your plants (and your project) will show it.
FAQ
If red+blue is best, why do seedlings sometimes look better under blue light alone?
If you match intensity correctly (same PPFD across treatments), red+blue usually yields the most biomass, but blue alone can still outperform red alone for early seedling sturdiness (shorter, less leggy hypocotyls). That means you can see “blue looks better” in height or thickness, even if red+blue wins in total fresh or dry weight later.
Can I keep the experiment fair by using equal wattage bulbs instead of measuring intensity?
Do not rely on “same wattage” or “same bulb brightness” claims. Different LEDs have different beam angles and spectra, so a 10 W red bulb and a 10 W blue bulb can deliver very different PPFD at the leaf surface. The clean approach is to measure PPFD or, if using a lux meter, adjust distance until lux is identical, then explicitly note lux is an imperfect proxy.
Will green light ever beat red+blue in a science fair?
Green can be useful, especially for thicker leaves, because it penetrates deeper into tissue. But in most short leafy-crop science fair setups (lettuce, radish, arugula) with intensity controlled, green tends to be weaker overall than red+blue for biomass. So it is worth testing, but it is less likely to “beat” the red+blue control.
How do I compare full-spectrum white to red+blue without accidentally changing other variables?
Do not treat “full-spectrum white” as automatically equivalent to red+blue. White includes other wavelengths (including yellow-green) and often differs in total PPFD. For a fair comparison, use the same PPFD for each treatment and verify that your “red” and “blue” treatments are truly isolated (no channel bleed).
Can I run the experiment longer than two or three weeks, and what changes when I do?
Yes, but you need a clear experimental plan. The light-color effect you test is only meaningful if photoperiod is identical (example: same 16 hours on, 8 hours off). Also keep temperature and watering consistent, because long exposures can raise leaf temperature and indirectly change growth.
What measurements should I record so my results are convincing?
Measure more than height. For leafy crops, fresh weight, dry weight (after drying), leaf count, and leaf area give a stronger picture of “best” than height alone. Height can be influenced by blue-driven compactness or by light stress, so two treatments can look similar in height but differ in biomass.
If I use colored filters on a white LED, is my light truly red or blue?
If your filters are colored gels, they reduce transmitted intensity and can also change the spectrum shape, not just the “color.” Always adjust distance and recheck the intensity after installing the filter, and note that your treatment is “filtered white” rather than “pure monochromatic wavelength.”
What’s the best way to keep the light exposure consistent across all plants?
Use each treatment with its own fixed fixture or keep the fixture position identical across groups. If you change distance to correct intensity, do it once and keep it constant, because changing distance also changes beam spread and uniformity across plants. Randomize plant placement within each chamber shelf if possible.
My plants grew, but my color differences were messy. What are the usual reasons?
If your results are confusing, the most common cause is intensity mismatch. The second most common cause is time mismatch (plants at different developmental stages) and inconsistent watering or soil depth. Build your plan around synchronized germination dates, and give every plant the same pot size and soil volume.
Which plants are best for a short science fair timeline, and why should I avoid tomatoes or peppers?
A simple yet strong setup is radish or lettuce because you can measure both shoot and, for radish, root growth within 2 to 3 weeks. Avoid slow, long-cycle plants, since small spectral effects may not have enough time to accumulate before the project ends.
Do LED safety precautions matter scientifically, or is it only about not staring at the lights?
Watch out for LED safety and also for optical bias in results. Staring at bright LEDs can be uncomfortable and risky (especially with blue), but it can also cause you to “avoid” certain angles or positions that affect intensity at the plant. Use eye protection if needed, and keep your measuring technique consistent across treatments.
If my project is about flowering or seedlings, does the “best color” change?
The “best” depends on the outcome. For vegetative growth and yield, red+blue typically wins. For early seedling compactness and reduced etiolation, blue is especially influential. For flowering, day length (photoperiod) becomes a major driver, so a short color-only test can miss the right factor.